

Clinically reviewed by Dr. Tina Gonzales Childress, AuD
If you’ve ever walked out of an audiology appointment staring at a chart full of dots and lines and wondered what they actually mean, you aren’t alone. To the untrained eye, an audiogram can feel less like a medical report and more like a complicated game of Tic-Tac-Toe.
At InnoCaption, we know that seeing those results for the first time can be overwhelming.
“Even though I grew up with hearing loss myself, I actually never learned how to read my own audiogram until I was in graduate school to become an audiologist,” says Dr. Michelle Hu, a practicing audiologist and founder of Mama Hu Hears.
“An audiogram can look confusing at first glance, especially when you’re still processing a diagnosis. I always remind families that it’s just a map that shows how sound is reaching your brain. Once you understand the map, you can start building a plan.”
In this guide, we’ll break down what an audiogram is, how to decode the symbols, and what those results actually mean for your day-to-day life.
An audiogram is a visual representation of the softest sounds you can hear at different pitches. Think of it as a "map" of your hearing.
“Your cochlea, or organ of hearing, is organized tonotopically, like keys on a piano," Dr. Hu explains. "Low pitches start on one side and go up to high pitches on the other. This is reflected on an audiogram: low pitches on the left, high pitches on the right. Soft sounds are at the top, and loud sounds are at the bottom."
To read the map, you need to follow the two axes:
On an audiogram, up is better. The closer your marks are to the top of the chart, the more "normal" the hearing threshold is for that pitch.
When you look at your completed chart, you will see lines connected by various symbols. These represent your ears individually because hearing loss is rarely identical in both ears.
The lines connecting these symbols show your hearing threshold, which is the very softest level at which you can hear a specific pitch at least 50% of the time.
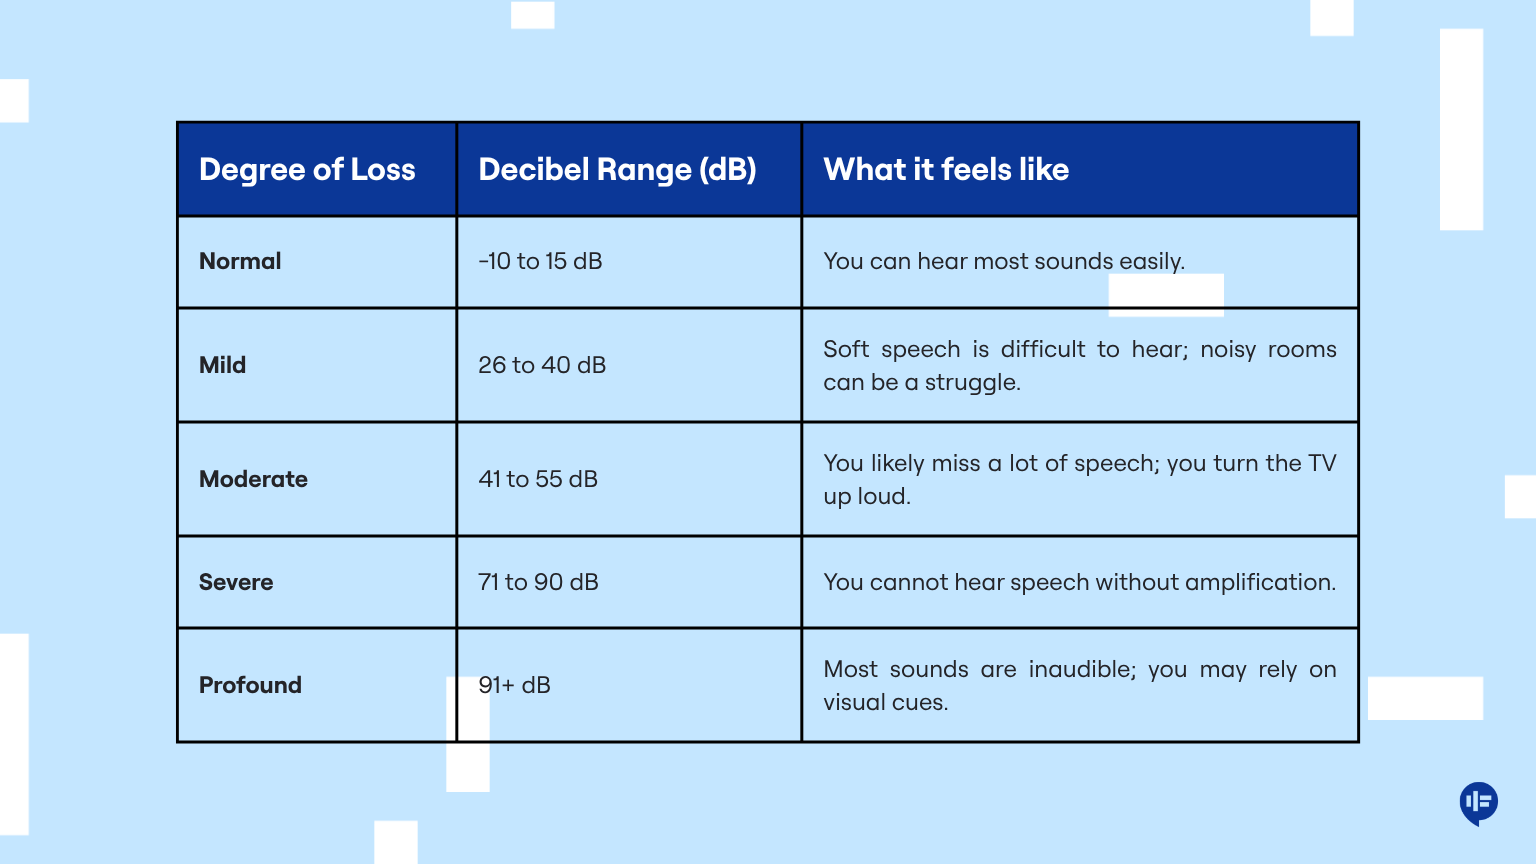
Audiologists categorize hearing based on where your symbols fall on the vertical (loudness) scale. Understanding your degree of hearing loss helps set expectations for everyday communication.
Your results might not be a straight line. Many people have "sloping" hearing loss, where they hear low pitches normally (dots at the top) but struggle with high pitches (dots at the bottom). This is a common pattern in age-related or noise-induced hearing loss.
You might be familiar with the “speech banana,” a concept clinicians used for decades to explain audiogram results. The idea was that most human speech sounds, or phonemes, fell within a banana-shaped area on the chart. If your marks fell below this area, the theory suggested you would likely struggle to understand conversations.
According to Dr. Hu, however, the speech banana is starting to phase out of clinical counseling because it isn’t entirely realistic.
“The speech banana doesn't account for 'speech in noise,' the biggest complaint for most patients, or the immense listening fatigue that comes with hearing loss,” she says. “Just because a sound 'fits' in the banana doesn't mean it's clear or easy to process."
This is why it’s so important to look beyond the dots on the page. Understanding your hearing is about more than just volume. It’s about considering your real-world listening effort.
Reading your audiogram is just the beginning. If your results show that you’re missing out on the sounds of life, it’s time to explore the tools available to you.
Ready to see what you’ve been missing? Download InnoCaption today and start making calls with confidence.


Minah Han is a marketing professional dedicated to advancing accessible communication solutions for the deaf and hard of hearing community. At InnoCaption, she leverages her expertise in digital marketing and storytelling to amplify the voices of individuals who rely on innovative technologies for everyday conversations. Minah is passionate about bridging the gap between technology and accessibility, helping to drive awareness and education around captioned calling solutions.
InnoCaption provides real-time captioning technology making phone calls easy and accessible for the deaf and hard of hearing community. Offered at no cost to individuals with hearing loss because we are certified by the FCC. InnoCaption is the only mobile app that offers real-time captioning of phone calls through live stenographers and automated speech recognition software. The choice is yours.